
Forex technical analysis: AUDUSD ignoring technicals (sort of)
But am still watching them
It is not like me to say the market is ignoring the technicals, but looking at the hourly chart, the AUDUSD over the last few days is taking a random walk, and yes, has ignored some technical levels that tend to provide bias clues. The price is trading above and below the 100 hour MA. The upward sloping trend was broken, then rebroken, then broken again. The topside trend line had looks above that failed today. The recent swing lows over the last three days has a low, a slightly higher low, a lower low and the last low took out all the low but failed to show any follow through
The market is out of sync with some very visual levels that are just not causing the expected energy or reaction.
That can happen. It tends to happen when the market is unsure of the next direction. When the market is non trending. The minute from the RBA talked of the concerns from hih unemployment, spare capacity, low investment, declining commodity prices, China slowdown, but wanted to see the impact of the record low rates on the economy. Housing is also a concern as lower rates spur on housing gains. So there is a potential for wait and see from the central bank. In fact the market is putting a 50-50 chance for a cut in April.
What we know is non-trending markets (and misbehavin markets) will tend to trend (and perhaps behave more correctly). So I will be keeping an eye out for that to happen.
Looking back at the hourly chart is there anything that I may hang a hat on?
- Although the topside trend line was breached, the moves above the trend line were minimal and they did fail. Bearish.
- The trend line had breaks above and below today but the last thing that failed was the dominant line. The lower trend line had found a number of lows that tested and held. Buyers were coming in. The initial failure below the trend line and move above, should have solicited a greater surge. It did not. Bearish.
- There are a number of bars where the price traded both above and below the 100 hour MA (blue line in the chart above) over the last few days. Usually, the price moves away from the 100 hour moving average (or at least does not trade above and below the MA line consistently). The current price is below the moving average. Bearish.
- The lows over the last few days was just broken, but the price rebounded back above. Bullish
Fundamentally, even if the chance of a cut is 50-50 in April, there is no chance the Federal reserve will cut, and a chance they will raise by June. This should benefit the US dollar. Unemployment in the US is also moving lower while it is moving higher in Australia. There's better chance for wage gains in the US as a result of less capacity in certain industries.
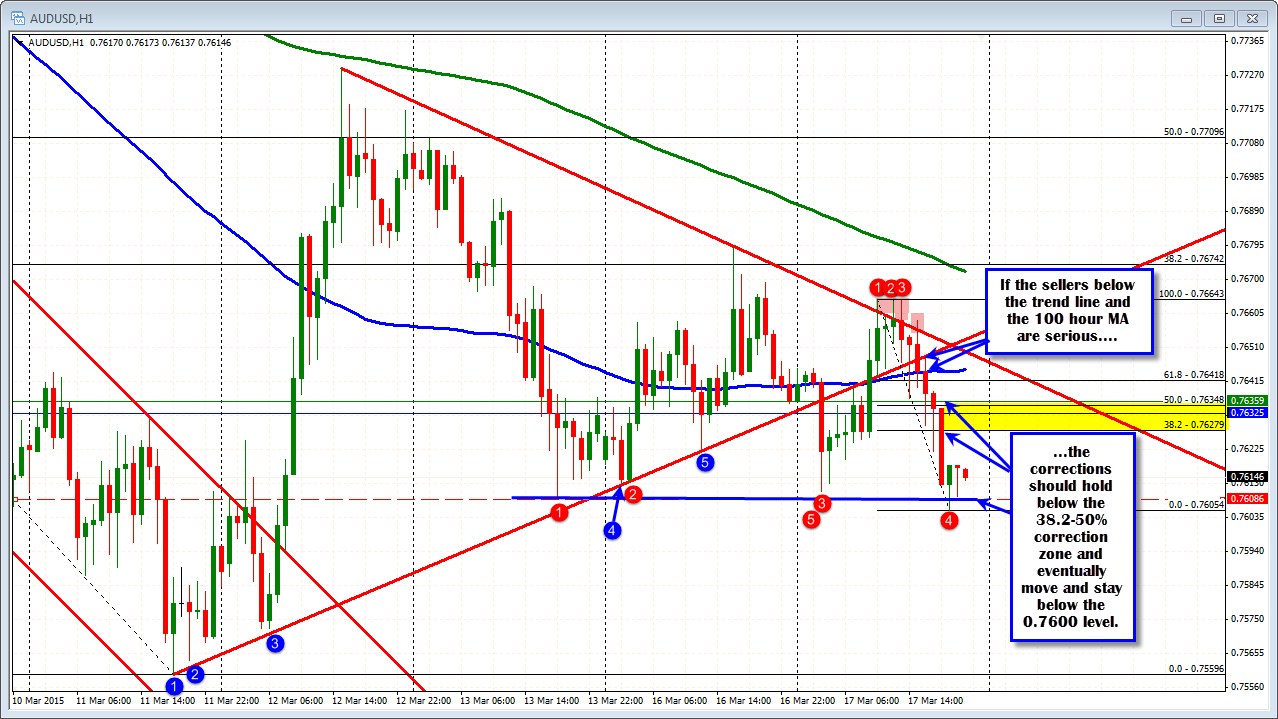
So overall, my bias is more bearish. I would need to see the price remain below the 100 hour moving average (risk defining level). On a break below the 0.7600 level, I would also like to see increased downside momentum, and the price stay below that level. On rallies, look for sellers in the 0.7627 to 0.7635 area. This is the 38.2 to 50% retracement of today's trading range. If the sellers through the trendline/through the 100 hour moving average, are serious, they should keep the price below this retracement area. A move above and I start to lose the faith.
(source:visit here)
Forex technical analysis: AUDUSD ignoring technicals (sort of)
![Forex technical analysis: AUDUSD ignoring technicals (sort of)]() Reviewed by kj
on
12:42:00
Rating:
Reviewed by kj
on
12:42:00
Rating:


No comments: